
DATA ANALYSIS + MACHINE LEARNING
MY PROJECTS
Exploring the World of Fashion: Classifying Clothing Using Convolutional Neural Networks
Explore the fascinating world of fashion with this machine learning project focused on the Fashion MNIST dataset. The dataset comprises 70,000 grayscale images spanning 10 distinct categories, showcasing various articles of clothing in low resolution (28 by 28 pixels). Leveraging the power of machine learning techniques and the TensorFlow library with the Keras API, I've crafted a Convolutional Neural Network (CNN). This CNN is designed to classify different items of clothing within the dataset, assigning each to its respective category.
Outcome: The project's ultimate goal is to create a robust and efficient system for classifying diverse fashion items, showcasing the application of convolutional neural networks in the realm of image classification. Through the combination of TensorFlow, Keras, and careful model design, the project aims to deliver accurate predictions for each clothing category.
Click Here to Access Project

Categories of Clothing
28x28 Grayscale Images

Exploring Pixel Values in the First Image
Predicting Levels of Happiness Around the World
This project focuses on analyzing the 2015 World Happiness Report, a publication ranking 158 countries based on happiness levels and well-being. Utilizing machine learning techniques, specifically Linear Regression and KNN (K-Nearest Neighbors), the project aims to explore, clean, visualize, and model happiness scores and regions of countries based on various variables present in the dataset. The World Happiness Index, calculated from survey data encompassing factors like GDP per capita, social support, healthy life expectancy, freedom of choice, generosity, and perceptions of corruption, serves as the key metric for assessing overall happiness.
Outcome: The project underscores the significance of incorporating happiness measures into policy-making and development strategies, providing insights into global happiness levels and offering recommendations for improving well-being.
Click Here to Access Project

World Map
Classifying Handwritten Digits
This project is focused on exploring the MNIST dataset, a collection of 28x28 grayscale images of handwritten digits (0 through 9) alongside corresponding labels. The objective was to develop a machine-learning model capable of accurately classifying these digits. Leveraging the pixel intensity values (ranging from 0 to 255) in the single-channel images. The project involved training and testing the machine learning model; in this case, I used a neural network to achieve the recognition of handwritten digits.


Feeding Image into Neural Network for Classification
Outcome: The ultimate goal was to ensure the model could correctly identify the numbers inscribed in the images, showcasing the application of machine learning in the realm of digit recognition.
Click Here to Access Project
Handwritten Digits
Predicting the Median House Value in California

In this notebook, we explore the relationship between different variables and their effect on the median house price in California in 1990. The main objective of the project is to be able to predict the value of the median house in California in the year 1990. To do this I began by analyzing correlations and variances among various variables. I selected independent and dependent variables and split the data into training and testing sets. I employed machine learning techniques by utilizing the LinearRegression model from the sklearn library which allowed me to train the model and make predictions. I visualized the relationship between the predicted and the actual house prices through a scatterplot and evaluated the model's performance using the mean squared error. Additionally, I made predictions for the median house value in 1990 by varying input variables.
Outcome: This project successfully builds a model for accurately predicting the median house value in California in 1990 and identifies the key variables influencing this prediction.

Click Here to Access Project
Spotify Top Hits Analysis
In this data science project "Spotify Top Hits Analysis," I harnessed the power of Spotify's rich dataset, which contains an array of song qualities like energy, key, loudness, and tempo. The project's objective was to develop a predictive model that could determine whether a song would become a top hit or not based on these musical attributes. After meticulous data preparation, I established the key and energy variables as independent factors and defined the top half of hits as the dependent variable. The dataset was then thoughtfully split into training and testing sets, enabling the model to learn and generalize. With hyperparameter tuning and model initialization, I achieved an optimal predictive performance. By visually representing the decision boundary, I shed light on the model's decision-making process. Results were presented, showcasing how the model could predict song success for different key and energy combinations. Furthermore, hyperparameter tuning yielded refinements, reinforcing the model's adaptability and potential in the realm of music analysis.
Outcome: This project underscores the transformative impact of data science and machine learning on the music industry, providing valuable insights for aspiring musicians and industry professionals.
Click Here to Access Project
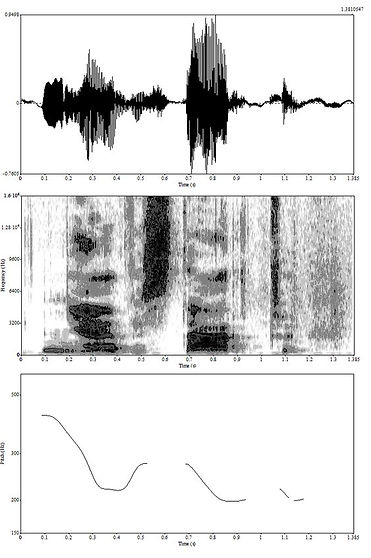
Frequency


Waveform
DeepVision: Classifying CIFAR-10 Images with Convolutional Neural Networks
This project focuses on the classification of small images from the renowned CIFAR-10 dataset using state-of-the-art Convolutional Neural Networks (CNNs).
Project Objective:
The primary goal of this project is to develop a robust image classification system capable of accurately identifying objects in small images. The CIFAR-10 dataset, sourced from TensorFlow's Keras datasets, poses a unique challenge with ten distinct classes, including airplanes, automobiles, birds, cats, deer, dogs, frogs, horses, ships, and trucks.
Why CIFAR-10?
CIFAR-10 serves as the perfect playground for testing the capabilities of our deep learning model. The diverse set of images and classes allows us to showcase the power of Convolutional Neural Networks in distinguishing between a wide range of objects.
Approach: Convolutional Neural Networks (CNNs)
To tackle the complexities of image classification, we leverage the strength of Convolutional Neural Networks. CNNs are designed to mimic the human visual system, enabling them to automatically learn and hierarchically represent features from images. By employing multiple convolutional and pooling layers, our model becomes adept at recognizing intricate patterns and spatial hierarchies within the images.
Classes:

Click Here to Access Project
Iris Species Classification
In this project, I delved into the iris species dataset, which showcases three distinct species of flowers. The dataset provides measurements for key botanical features, including sepal length, sepal width, petal length, and petal width, all recorded in centimeters. Leveraging these informative columns as features, the objective was to predict the specific species of each flower. To achieve this, I employed three different machine learning algorithms: Support Vector Machine (SVM), Logistic Regression, and the Decision Tree Classifier. Through this exploration, the project aimed to harness the power of these algorithms to accurately classify the iris flowers based on their characteristic measurements.


Click Here to Access Project
Titanic Survival Prediction
In this project, I delved into the renowned Titanic dataset, embarking on a journey to predict the likelihood of survival using a variety of machine-learning models. The objective was to unravel patterns within the data and employ predictive algorithms to determine the fate of passengers aboard the ill-fated Titanic.
Data Preprocessing: The initial phase involved meticulous data cleaning, where I addressed missing values by imputing the median values for respective columns. Additionally, I removed irrelevant features that were deemed inconsequential to predicting survival outcomes. This step laid the foundation for a streamlined and robust dataset, ensuring optimal performance in subsequent model training.
Machine Learning Models: To unravel the mysteries within the data, I employed an arsenal of machine learning models, each with its unique strengths and capabilities. The ensemble of models included:
-
Logistic Regression
-
Support Vector Machine
-
Decision Tree
-
Random Forest
-
K-Nearest Neighbors
-
Stochastic Gradient Descent
-
Gaussian Naive Bayes
-
Gradient Boosting Classifier
-
Extreme Gradient Boosting (XGBoost)
Model Comparison: A pivotal aspect of the project involved comparing the accuracy scores of each model. This evaluation process enabled me to determine the most effective model for predicting survival outcomes.
Outcome: The culmination of this project not only provided insights into the predictive power of various machine learning models but also allowed me to derive valuable patterns within the Titanic dataset.

Click Here to Access Project
Gradient Descent Visualization in 3D
Bridging Multivariable Calculus and Machine Learning
This interactive project was born out of a desire to connect the theoretical foundations of multivariable calculus with practical applications in machine learning. By visualizing gradient descent on a 3D surface, this project aims to build an intuitive understanding of optimization algorithms and uncover the mathematics that power machine learning.
Key Highlights:
-
Dynamic 3D Surface: Watch as points traverse a sinusoidal landscape created using mathematical functions.
-
Gradient Descent in Action: See how different starting points follow the gradient to converge at minima.
-
Applied Mathematics: Experience how concepts like partial derivatives and gradients from multivariable calculus drive machine learning optimization.
-
Adjustable Learning Rates: Observe how changes in learning rate affect the speed and trajectory of convergence.
Built With:
-
Python for computation and animation.
-
NumPy for efficient mathematical operations.
-
Matplotlib for stunning 3D visualizations.
Why It Matters:
Understanding the math behind machine learning algorithms is crucial for developing an intuitive grasp of how they work. Gradient descent, a cornerstone of optimization in ML, is brought to life here to bridge the gap between theory and practice.
Perfect For:
-
Machine learning enthusiasts and students looking to grasp optimization concepts.
-
Those seeking a deeper understanding of the mathematical principles underpinning ML algorithms.
-
Educators aiming to visually demonstrate the interplay between calculus and machine learning.
This project is an engaging way to explore how mathematical theories translate into practical algorithms that shape the future of technology. Dive in and experience the beauty of applied mathematics!
Visualization in 3D


Visualization in 2D


Click Here to Access Project
Stock Price Predictor
This project aims to predict the daily price movement of the S&P 500 index using machine learning, specifically the Random Forest Classifier. It follows these main steps:
-
Data Acquisition and Preparation:
-
Retrieves historical S&P 500 data using yfinance.
-
Cleans and prepares the data by removing unnecessary columns (Dividends, Stock Splits), and creating a 'Target' column indicating whether the closing price will be higher the next day (1) or lower (0).
-
-
Initial Model Building and Evaluation:
-
Trains a basic Random Forest Classifier using features like 'Close', 'Volume', 'Open', 'High', and 'Low'.
-
Splits the data into training and testing sets.
-
Evaluates the model's performance using precision score.
-
-
Backtesting:
-
Implements a backtesting function to assess the model's performance over different periods.
-
This function repeatedly trains and tests the model on different segments of the data.
-
-
Feature Engineering:
-
Introduces new features based on rolling averages and trends over various horizons (2, 5, 60, 250, 1000 days).
-
Calculates ratios between the current closing price and rolling averages.
-
Adds a trend feature to capture the sum of 'Target' values in the rolling window.
-
-
Improved Model and Evaluation:
-
Trains a refined Random Forest Classifier with the new features and adjusted parameters.
-
Modifies the prediction function to use prediction probabilities and a threshold for assigning predictions.
-
Evaluates the performance of the improved model using backtesting and precision score.
-
In essence, the project attempts to predict whether the S&P 500 will close higher or lower the next day, leveraging historical price and volume data, along with engineered features that capture trends and momentum. The goal is to build a model that can achieve a higher precision score, potentially helping in making investment decisions. I hope this summary is helpful! Let me know if you have more questions.
Click Here to Access Project
The Future Force
Conscious Entity